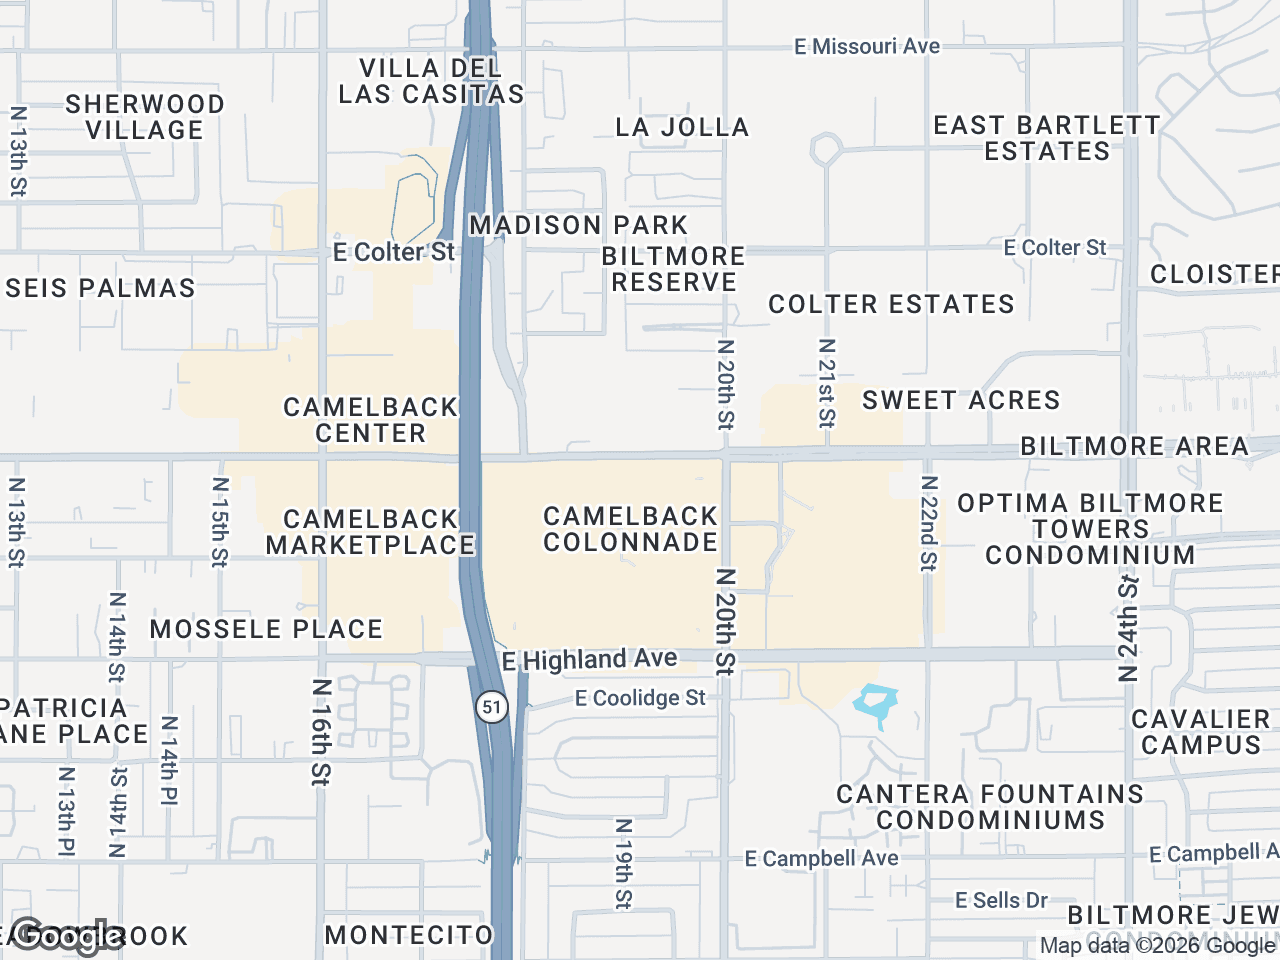



If you need to map restaurants near commercial property, the goal is to show verified food-and-beverage locations around the site. A restaurant map provides spatial context; it does not establish traffic, daytime population, sales, demand, or lease-up performance.
Why map restaurants near commercial property for retail leasing
A restaurant proximity map can show selected, verified food-and-beverage locations near the subject property. It does not establish traffic, lunch demand, visit patterns, sales, or concept performance.
For landlords and leasing teams, the map can prompt questions for separate research:
- What current evidence says about visits and cross-shopping
- Whether the surrounding food mix is relevant to the prospective tenant
- How the subject site relates to inline, endcap, or pad locations
- Which verified locations belong in an OM or leasing pitch
A corridor with several QSRs looks different on a map from one with mostly sit-down restaurants. Interpret that pattern against the tenant's criteria and current market evidence.
How to map restaurants near commercial property step by step
A practical way to map restaurants near commercial property is to start with the subject site, review nearby food-and-beverage results by category, and then organize selected locations so the pattern is easy to read. The step-by-step map guides cover the editor basics.
- Start with the property location
Add the subject property first and label it clearly. Use a customizable subject property marker so the site stands out from surrounding tenants. This keeps the map centered on the real leasing story: what is near the property, not just what exists in the broader submarket.
- Search nearby restaurant categories
Use category-based search across the visible map area. Review the returned food-and-beverage businesses and select the relevant locations; do not assume the results include every operator or current business.
- Review artwork for selected QSR and restaurant locations
Search brand-artwork candidates and verify each proposed match, business name, and location before placement.
- Clean up the layout with leader lines
Restaurant corridors often have dense clustering, especially around signalized intersections or power centers. Use leader lines to connect logos to their exact locations while keeping the visual layout readable. This is especially helpful when several brands sit within the same outparcel row or shopping center frontage.
- Group dining clusters visually
If the property is near a concentrated food node, use drag-to-group containers to create labeled clusters such as Drive-Thru QSR, Coffee & Breakfast, or Fast Casual Dining. This turns a busy map into a structured food and beverage tenant map that tells a clearer story.
- Choose a map style that fits the audience
For leasing presentations, a light or silver map style usually works well because logos and property labels stay prominent. Satellite can help when access, parking fields, or pad relationships matter. The right style depends on whether you are emphasizing branding, context, or site visibility.
- Export the map for marketing use
Pro users can export a 2D PNG/JPG up to 8,000 pixels, a 3D image up to 4,096 pixels, or one of five PDF layouts. Review the output in the OM or leasing flyer.
What to include in a QSR map CRE brokers can use in OMs
A useful QSR map CRE deliverable is not just a collection of logos. It should support a sourced leasing narrative. For document placement, see retail maps for offering memorandums.
Include these elements:
- Subject property marker with a clear label
- Nearby QSR and restaurant logos that are most recognizable
- Leader lines in dense retail nodes
- Grouped restaurant clusters where appropriate
- A map style that keeps roads and retail context readable
- Clean spacing so the map works in both PDF and presentation formats
You do not need to show every food operator in the market. Select the verified locations and clusters that are relevant to the assignment, then simplify the layout until the location context is clear.
How to interpret a restaurant proximity map around a site
Once you build the map, interpret the visible pattern cautiously. A restaurant proximity map can identify locations to investigate for a leasing or merchandising brief.
Dense QSR concentration is a research lead
If the property is surrounded by drive-thru coffee, burger, chicken, and fast-casual brands, the map documents a cluster. Validate any claim about convenience traffic or repeat visits with a suitable data source.
Dining clusters can validate an established retail node
Multiple restaurant brands in one pocket show current or recently recorded co-location. The map does not reveal why each operator selected the site or whether the intersection is financially proven.
Gaps can be just as important as clusters
Limited results may justify further research, but absence from a search is not proof of unmet demand or white space. Check the visible area, business status, planned supply, demographics, traffic, and tenant criteria.
Best practices when you map restaurants near commercial property
When you map restaurants near commercial property, keep the audience in mind. A landlord rep, tenant rep, and investor may all use the same map differently, but all of them need clarity.
A few practical best practices:
- Prioritize nationally recognized brands first, then add strong regional concepts if they matter locally
- Avoid overloading the map with every nearby business
- Use grouped containers to separate coffee, QSR, and casual dining when the area is dense
- Make sure the subject property remains the visual focal point
- Match colors and branding if the map will appear in a broker package or OM
If you create these maps regularly, CRE Retail Maps combines nearby search, artwork review, leader lines, nine styles, and Pro exports in one workflow.
When a food and beverage tenant map is most useful
A food and beverage tenant map is especially effective in these situations:
- New listing packages for shop space or pad sites
- Retail lease-up campaigns where co-tenancy matters
- OM support for strip centers and neighborhood centers
- Tenant outreach to restaurant, coffee, or fast casual operators
- Market overviews that need a clear visual of selected nearby businesses
In each case, the map helps translate location into something tangible. Instead of saying a property is "near strong food traffic," you can show the actual brands and clusters around the site.
Conclusion
To map restaurants near commercial property, focus on the subject site, review nearby results, verify selected locations and artwork, and organize the dining cluster clearly. Free supports building and previewing up to three maps; downloads require Pro.
CRE Retail Maps Editorial Team
VerifiedCRE Software & Industry Analysis
The CRE Retail Maps editorial team produces in-depth analysis of commercial real estate technology, retail market trends, and broker workflows. Our content is reviewed by retail brokers and industry practitioners with decades of combined experience covering grocery-anchored, power center, and lifestyle retail across major US markets.