


A mall map maker built for commercial real estate gives you a logo-based leasing visual of your center, not a CAD site plan. If you need to show a prospective tenant or investor which brands occupy a shopping center and where they sit relative to the available space, that visual is the deliverable.
What a Mall Map Maker Actually Produces
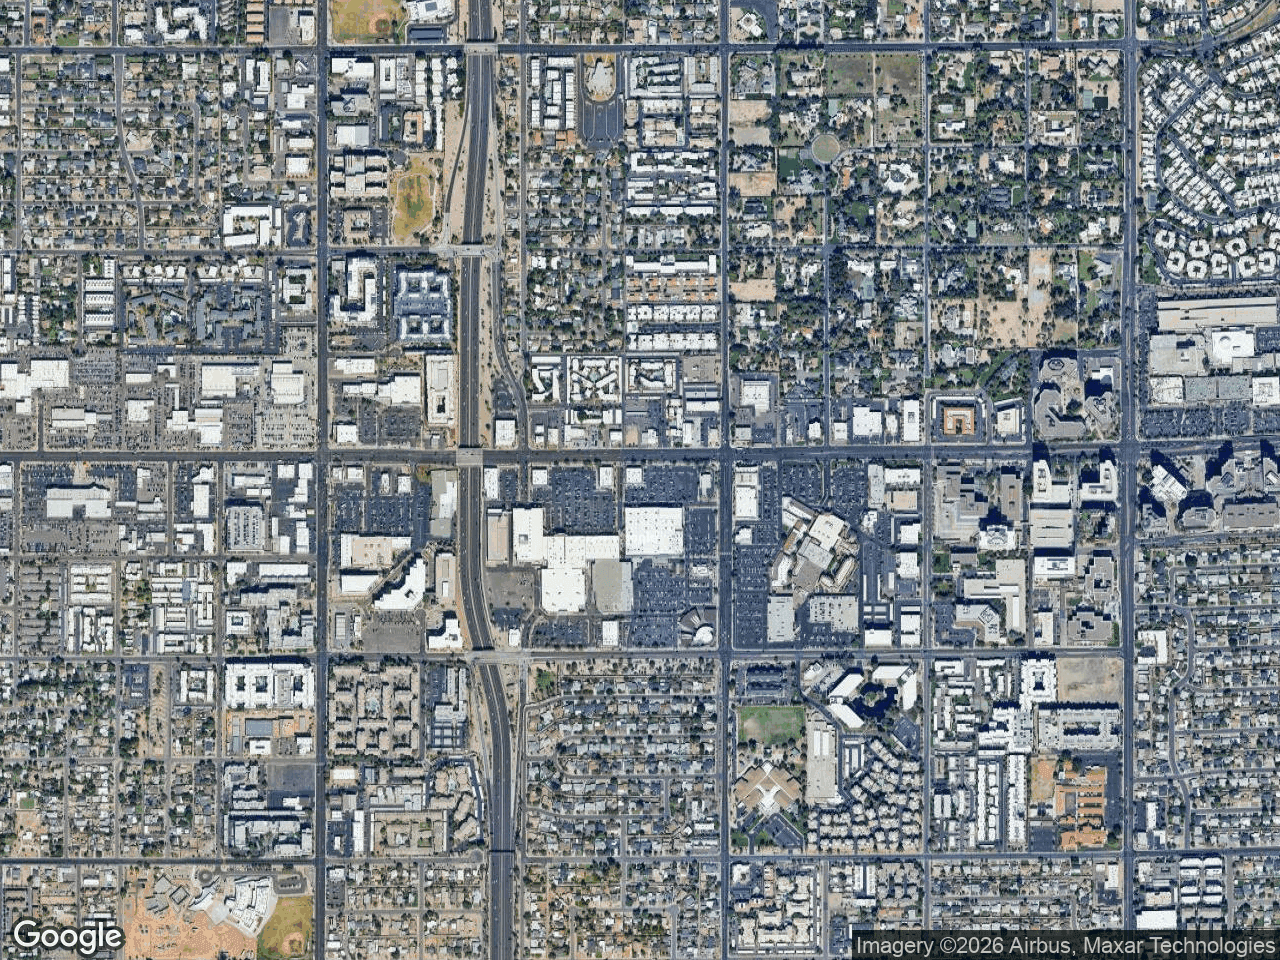
Be clear on the output before you start. A leasing-focused map tool produces a styled, branded image: a basemap of the center and its surrounding retail, brand logos marking each tenant, leader lines tying each logo to its location, and a subject property marker on the space you are leasing or selling.
What it does not produce is an architect's site plan. There are no bay dimensions, no square footage callouts drawn to scale, no GLA schedules, and no parking field counts. Those live in your CAD drawings and your rent roll. The two documents serve different audiences. A site plan answers "how big is the bay and where does the door go." A leasing plan map answers "who is already here and why does that matter for my brand."
Most brokers need both. The CAD plan goes in the appendix. The logo map goes on page two of the offering memorandum, where a tenant rep scanning the package can see at a glance whether the co-tenancy fits their client.
How to Use a Mall Map Maker: Step by Step
The workflow below assumes you are building a shopping center map maker output for a leasing flyer or an OM.
- Center and frame the map. Load the center's address and zoom until the full property plus the immediate retail node fills the frame. Decide now whether the story is the center itself or the center within its trade area, because that framing drives everything else.
- Place the subject property marker. Drop a marker on the available space and label it with the suite identifier and square footage. This is the anchor of the entire graphic.
- Add tenants with nearby search. Search businesses in the visible map area by category, then review the results and select the ones you want. Confirm each hit against what you know is actually open, since listings go stale and a closed tenant on a leasing map is a credibility problem.
- Attach brand artwork. Search the artwork library for each tenant and review the candidates before placing one. Verify the mark matches the banner operating at that location. Regional banners, sub-brands, and rebrands are common failure points.
- Run leader lines. Connect each logo to its actual position so the map reads cleanly even when logos sit outside the building footprint. Short, non-crossing lines are the goal.
- Group the logos. Organize tenants into labeled logo groups: anchor tenants, inline tenants, pad sites, adjacent centers. The step-by-step guides cover grouping in detail.
- Apply a map style and color scheme. Pick from the nine styles, then set a custom color scheme to match your brokerage palette so the map looks native to your marketing package.
- Export. Use 2D PNG or JPG up to 8000 pixels for print and flyers, or the 3D map image export up to 4096 pixels when you want a hero image. For a bound package, drop the map into one of the five PDF layouts.
Grouping Tenants for a Leasing Plan Map
Grouping is what separates a usable leasing plan map from a pile of logos. Anchors carry the co-tenancy argument, so give them their own labeled group and let them read first. Inline tenants support the daily-needs story. Pad sites and the drive-thru QSRs signal traffic patterns. When a prospect scans the map, those three clusters should be legible without reading a single label.
Building a Mall Site Plan Companion Graphic
If your package already includes a dimensioned mall site plan, treat the logo map as the companion piece, not a replacement. Match the orientation of both documents so the reader does not have to mentally rotate one to understand the other. Keep the subject property marker in the same relative position on both. Small consistency choices like these reduce the cognitive load on a tenant rep reviewing ten packages in an afternoon.
Mall Map Maker vs. General Design Tools
Brokers who have not used a purpose-built tool usually fall back on one of three approaches.
| Approach | Brand logos | Accurate geography | Export quality | Rebuild for new vacancy |
|---|---|---|---|---|
| Screenshot plus PowerPoint | Manual sourcing | Degraded by cropping | Low resolution | Full rebuild |
| General graphic design app | Manual sourcing | No basemap | High | Full rebuild |
| CAD site plan | None | To scale | High | Requires drafter |
| Purpose-built retail map tool | Searchable library | Live basemap | Up to 8000 px | Relabel the marker |
The tradeoff is specialization. A general design tool will do more things; a tool built as retail map software for CRE brokers does this one thing without the setup tax. If you only build a center map twice a year, the general tool is probably fine. If you are producing leasing collateral every week, the specialized workflow pays back quickly.
What to Include in the OM Version
The OM version of your center map carries more weight than the flyer version, because an investor is underwriting the rent roll against what they see. Keep the tenant set honest and complete for the trade area you are showing. Label anchors clearly, since anchor credit and co-tenancy clauses are what a buyer will model. If your package makes a demographic or traffic count argument, source that data from your market research provider and present it in its own exhibit. The map's job is to show who is there, not to carry the analytics.
Our guide to retail maps for offering memorandums covers layout decisions for bound packages, including which of the PDF layouts fits a two-page tenant mix section.
Choosing a Shopping Center Map Maker
Evaluate on four things: how fast you can get brand artwork onto the map, whether the basemap styling matches your brand standards, export resolution for print, and how quickly you can produce a variation for the next vacancy. Resolution matters more than brokers expect. A map that looks sharp on screen can fall apart in a printed OM, so test an 8000 pixel export through your actual print pipeline before you commit to a workflow.
Also check what the tool does not claim. A logo mapping tool is not a GIS platform, and any tool suggesting otherwise is worth a closer look.
Putting It Together
A center map is a persuasion document. It compresses the co-tenancy argument into a single visual that a tenant rep or an investor can scan quickly, and it earns its place at the front of your leasing package. The workflow above is repeatable, and once a center's base map exists, every future vacancy is a matter of moving a marker.
CRE Retail Maps handles the logo placement, leader lines, grouping, styling, and export described here. You can build and preview up to three maps on the free tier to see whether the output fits your package, then move to Pro at $39/month or $379/year when you need downloads and unlimited maps. Start building at CRE Retail Maps.
CRE Retail Maps Editorial Team
VerifiedCRE Software & Industry Analysis
The CRE Retail Maps editorial team produces in-depth analysis of commercial real estate technology, retail market trends, and broker workflows. Our content is reviewed by retail brokers and industry practitioners with decades of combined experience covering grocery-anchored, power center, and lifestyle retail across major US markets.