Tenant rep maps for a clear site comparison.
Build a consistent retail landscape map for each candidate site, document the selected co-tenant context, and apply your firm's styling to a Pro PDF or image export.
- Use a repeatable layout across candidate-site maps
- Search and review brand artwork candidates
- Consistent visual scope across candidate-site maps
- Five branded PDF layouts for tenant pitch decks
- Save and reuse POIs across markets and clients
Build and preview up to three maps free. Downloads require Pro.
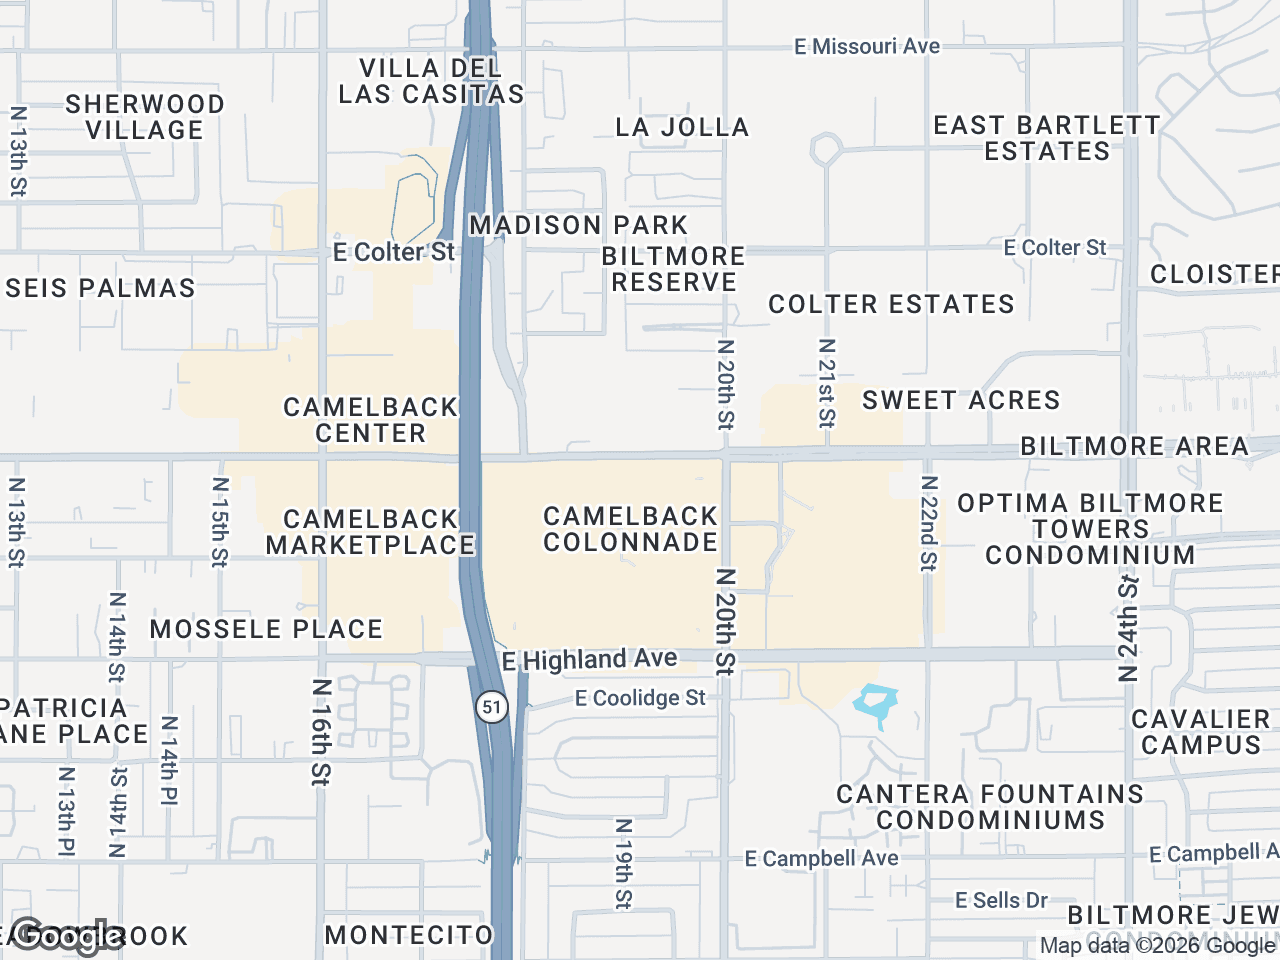


Built for the tenant rep workflow
Repeatable candidate-site maps
Use the same visible scope, base style, subject marker, and labeling convention for every location in the comparison set.
Reviewed co-tenant context
Search the visible map area, verify returned names and addresses, then place only the businesses that are relevant to the assignment.
Reusable retailer and competitor POIs
Save reviewed locations as custom POIs on Pro, then verify their current status again before reusing them in a new market or client deck.
Clear visual hierarchy
Separate the candidate site, existing stores, competitors, anchors, and other selected businesses with consistent colors, groups, labels, and leader lines.
2D and photorealistic 3D views
Use a clean 2D map for road and label clarity, or an angled 3D view when buildings, parking fields, and physical context help tell the site story.
Client-ready exports on Pro
Download high-resolution 2D or 3D images, or choose one of five PDF layouts and review every field before placing the file in a pitch deck.
Where mapping fits in tenant representation
A candidate-site map should make selected location context easier to scan; it should not replace demographic, mobility, customer, sales, lease, or field-research evidence. Keep those analytical sources separate and cite them in the final recommendation.
CRE Retail Maps is the presentation layer for reviewed locations. Build one map per candidate, apply the same visual rules, and place the finished exports beside the underlying site-selection analysis in the client deck.
That separation keeps the visual comparison useful without implying that nearby-search results are complete, that a business is a confirmed co-tenant, or that the map itself establishes trade-area performance.
A repeatable candidate-site mapping workflow
Use the same six-step process for every site so visual differences come from the locations—not from inconsistent map framing or styling.
1. Define the comparison standard
Choose the visible area, base style, label rules, subject marker, export dimensions, and business categories before building the first map.
2. Create one map per candidate
Center each map on the reviewed property address and name it with a consistent convention such as market, cross streets, and site number.
3. Verify nearby locations
Search the visible area, then confirm each selected business's name, address, operating status, and mapped coordinate using a current source.
4. Apply a shared visual hierarchy
Use one treatment for candidate sites, another for existing stores or competitors, and consistent groups for anchors or selected co-tenants.
5. Save and quality-check
Confirm the latest save, compare the maps side by side, and check that zoom, labels, colors, logo scale, and information density are genuinely comparable.
6. Export for the client deck
On Pro, export every map at the same dimensions or with the same PDF layout, then review the files in the final presentation before sharing.
What a tenant rep map can—and cannot—show
The map is strongest when its role is explicit: it organizes reviewed spatial context while the decision model remains grounded in separately sourced evidence.
Show: selected retail context
Display the candidate property, reviewed nearby businesses, existing stores, selected competitors, major roads, and other verified points relevant to the assignment.
Show: a consistent comparison frame
Use matching scope and styling so the client can compare the visible location context without decoding a different map design for every candidate.
Do not infer: demand or performance
Nearby businesses do not establish sales potential, customer demand, traffic, cannibalization, or site quality. Support those claims with the appropriate current research.
Do not infer: tenancy or availability
A map search result does not confirm a lease, vacancy, cotenancy provision, or current occupancy. Verify property facts through authoritative deal and property sources.
Quality-control checklist before a retailer presentation
Run the same review on every candidate map before it enters a pitch deck or client email.
Location accuracy
Confirm the subject address, each business address, every leader-line anchor, and any custom POI coordinates against current sources.
Artwork and labeling
Review every artwork candidate, remove stale or irrelevant businesses, spell all labels consistently, and use images you are authorized to publish.
Comparable framing
Check that maps use a deliberately consistent visible scope, base style, label density, subject treatment, and output dimensions.
Source and date notes
Document when locations were checked and cite separate sources for demographics, traffic, visitation, rents, availability, and other decision inputs.
Final-file review
Open each exported image or PDF in the actual deck, inspect it at presentation size, and confirm profile, property, and contact details before distribution.
Clear limitations
Explain that the visual includes selected, reviewed context rather than a complete inventory or an analytical conclusion about the site.
Tenant rep workflow FAQs
Can I save my retailer client's existing stores as POIs?+
Yes. Pro users can save a custom name and address with an optional uploaded logo, then reuse those saved POIs on future maps. Verify each saved location before publishing.
Can I generate drive-time or radius analysis?+
No. CRE Retail Maps does not generate drive-time polygons or fixed-radius rings. Source that analysis separately from a suitable GIS or analytics provider.
Does it support multi-site comparison decks?+
Yes. Save each candidate site map separately, export each on Pro, and combine the files in your final pitch deck. Reuse the same branded layout for consistency.
Does nearby search confirm that a business is a current co-tenant?+
No. Nearby search returns businesses in the visible map area; it does not confirm current tenancy, lease status, vacancy, or a contractual co-tenancy relationship. Verify those facts using current property and deal sources.
Can I use both 2D and 3D maps in a site presentation?+
Yes. Use 2D when roads, labels, and a clean comparison frame matter most. Use photorealistic 3D when an angled view of buildings, parking, and physical context adds value. Pro is required to download either view.
What about analyzing demographics or income deciles?+
We're a visualization tool, not a demographics platform. For trade area demographic analysis, pair us with Esri Business Analyst, Placer.ai, or PiinPoint. We handle the visual map; they handle the data layer.
Can I share maps with my retailer client?+
Yes. On Pro, export a branded PDF or high-resolution image, then email the file or include it in your pitch deck.
Related resources
Retail Map Software for CRE Brokers
The full product overview: artwork review, nearby-business search, styling, and Pro exports.
Learn moreHow to Find Nearby Businesses
Search the visible map area, then verify and select relevant results.
Learn moreSave and Reuse Custom POIs
Build a reviewed library of retailer, competitor, and other client-specific locations.
Learn moreCreate and Edit 3D Maps
Frame, edit, save, and export a photorealistic 3D retail map.
Learn moreHow to Export Retail Maps
Use consistent image dimensions or one of five Pro PDF layouts.
Learn morePricing
Build and preview up to three maps free; Pro unlocks downloads.
Learn moreBuild your next site-selection map
Build and preview up to three candidate-site maps free. Downloads require Pro.
Start Free