OM maps that close deals.
When you're selling a retail center to an institutional buyer, the maps in the OM either tell the story or they don't. CRE Retail Maps lets you build the branded retail landscape map every retail OM needs - in 15 minutes, for $39/mo.
- Branded retail landscape map for every offering memorandum
- 1,000+ tenant logos drop onto the map in seconds
- Drive-time circles + radius rings for trade area context
- Anchor tenant grouping with labeled containers
- PDF templates with your firm's branding, ready for institutional buyers
Free tier works fully. No credit card.


Built for the retail investment sales workflow
OM-ready output
Every map exports as a branded PDF that drops straight into your OM template. Your firm's logo, contact block, and styling on every page. No Photoshop cleanup.
Anchor tenant emphasis
Use larger logo sizes for the anchors that drive value, with smaller logos for in-line tenants. Drag-to-group containers labeled 'Anchors,' 'Co-tenants,' and 'Pad Sites' communicate the value story instantly.
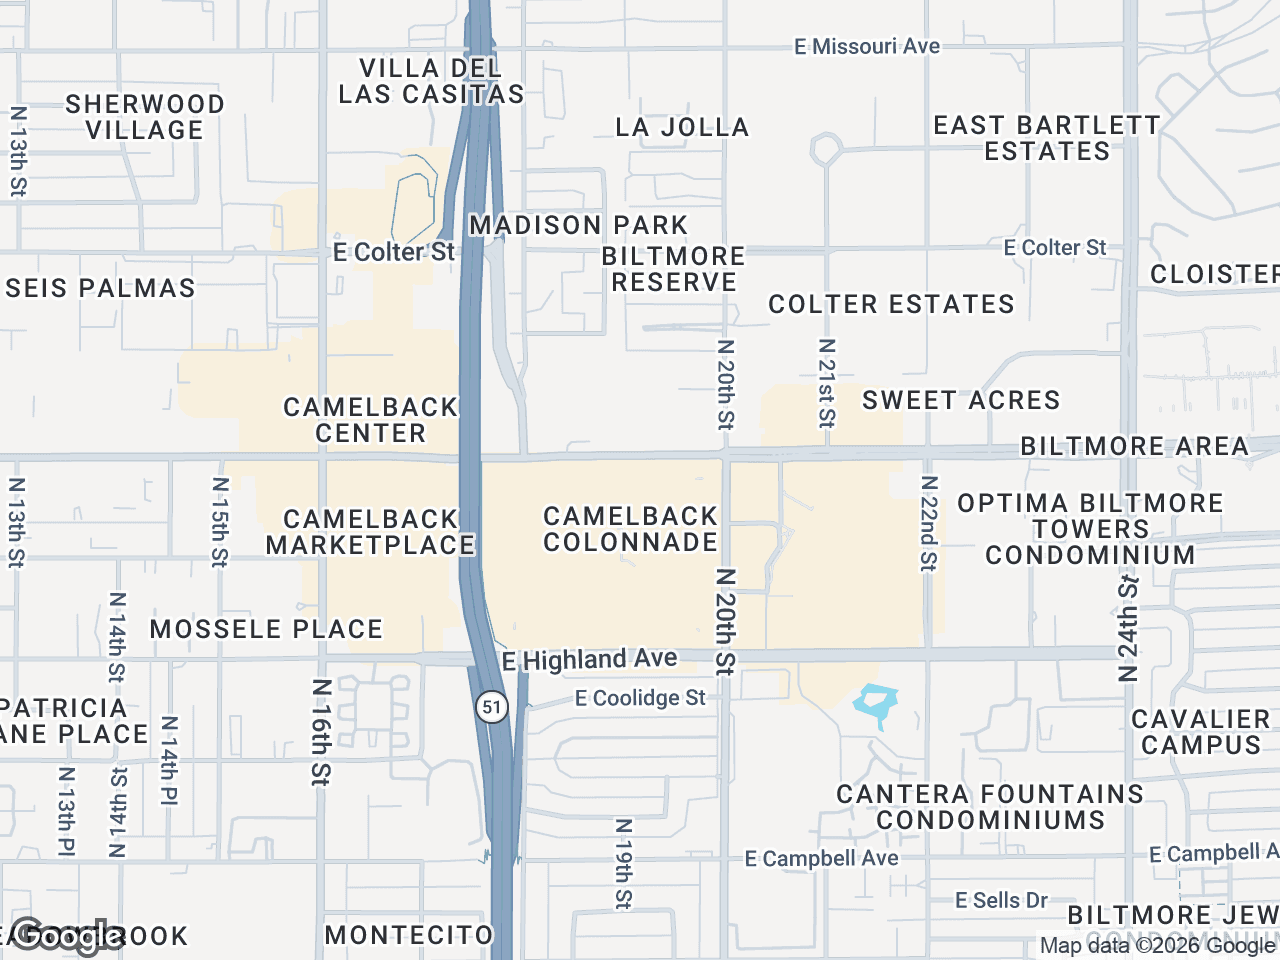
Trade area at a glance
Drop 1-mile, 3-mile, and 5-mile rings, or drive-time circles, to visually communicate the trade area to institutional buyers and their investment committees.
How investment sales brokers use CRE Retail Maps
Retail investment sales OMs live or die on the strength of the tenant story and the trade area. The map on the 'Tenant Landscape' page of every OM is what an institutional buyer flips to first - it's the visual that anchors their first impression of the asset.
Investment sales brokers using CRE Retail Maps standardize their OM map format: branded for the firm, anchor logos at larger size, co-tenants in a labeled container, drive-time circles overlaid, and the subject property called out with a labeled marker. Every OM in the practice has the same look, which builds brand recognition with the institutional buyer pool.
For larger institutional teams, the time savings compound across deals. What used to be a half-day Adobe Illustrator project for the OM map team becomes a 15-minute job per OM, freeing up the analyst hours for actual underwriting work. The output looks more consistent, the OMs go out faster, and the buyer feedback on visual quality improves.
Investment sales workflow FAQs
Can I produce institutional-grade output for nine-figure deals?+
Yes. Many institutional brokers use CRE Retail Maps for OMs ranging from $5M strip centers to nine-figure portfolio sales. The branded PDF templates produce print-ready output suitable for any asset class within retail.
Can I use my firm's specific brand colors and fonts?+
Yes for colors via the custom hex picker. Fonts on map labels are limited to a few presets - the brand identity comes through the PDF template (your logo, contact block, color palette).
Can I show sales comps or cap rate data on the map?+
Not directly - we don't host sales comp data. You'd source comps from CoStar, RCA, or your firm's database, then add them to the map as POI annotations.
Does it support portfolio sales with multiple properties?+
Yes. Build one map per property, then combine them as separate pages in your portfolio OM. Each map carries the same branded template for visual consistency.
What about confidentiality - can I keep maps private?+
All maps are private to your account by default. Nothing is published or shared without you explicitly exporting and sending the file.
Related resources
Retail Map Software for CRE Brokers
The full product overview: logos, trade areas, and branded exports.
Learn moreFree Retail Map Maker
Build a professional retail map for free, no credit card required.
Learn moreRetail Map Maker
The fastest way to build a professional retail map.
Learn moreGetting Started Guide
Create your first retail map from an address in minutes.
Learn moreExport to PDF or 4K PNG
Download branded, print-ready maps for OMs and flyers.
Learn morePricing
Free to start; Pro unlocks unlimited maps and exports.
Learn more