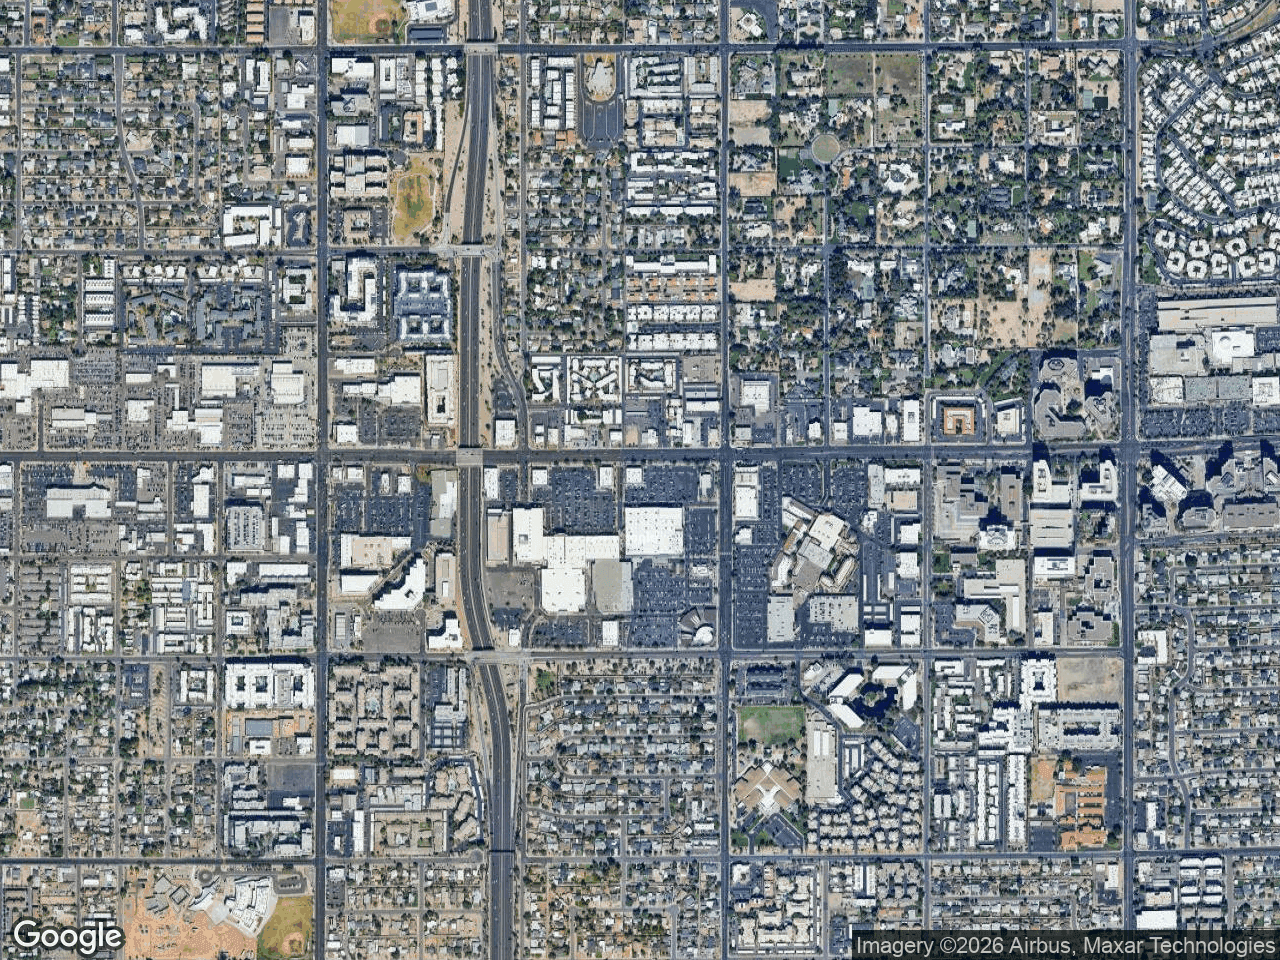



An offering memorandum often needs to explain where a retail asset sits, which verified businesses are nearby, and how the property connects to roads and surrounding development. A readable map can support that explanation, but it does not establish asset quality, buyer interest, traffic, or valuation by itself.
Why Retail Maps Belong in an Investment-Sales OM
Investment-sale materials combine financial, physical, market, and location evidence. A retail map helps a reader orient themselves before reviewing the deeper underwriting materials.
The map should use legible labels, verified locations, and a clear subject-property marker. Avoid implying that visual polish validates the asset or replaces underwriting.
The Visual Hierarchy of an Institutional Buyer Presentation
In a buyer presentation, the location map can answer a focused question: Where is this asset, and which verified features and businesses surround it?
Prioritize visual clarity over data density. Demographic, traffic, and visitation metrics need their own cited sources and definitions; CRE Retail Maps does not generate those analytics.
What to Show on the Map
A useful map generally covers three types of location context.
National Credit Tenant Mix and Brand Logos
Recognizable brand artwork can make a surrounding-tenant map easier to scan, but nearby brands do not prove the subject property's tenant quality or trade-area performance.
CRE Retail Maps provides searchable brand-artwork candidates. Review each candidate and verify the business name, tenant status, and location before placement; the search result is not a guarantee of the correct mark.
Proximity to Traffic Generators and Highway Access
Visibility and access drive retail valuations. Institutional buyers want to visually confirm the relationship between the subject property and major demand drivers:
- Highway interchanges and major arterial intersections
- Regional malls, power centers, or big-box anchors
- Dense residential feeder neighborhoods
- Employment hubs or medical centers
- University campuses or military installations
Leader lines that connect brand logos directly to their precise map locations make these proximity relationships immediately clear. A buyer should be able to trace a line from a major anchor tenant to the subject property in seconds, understanding the co-tenancy benefits without reading a paragraph of text.
Anchor Tenant Presence and Co-Tenancy Strength
When a verified anchor is relevant to the assignment, show its reviewed location and artwork clearly. Do not infer value, buyer requirements, credit quality, or property performance from the anchor's presence alone.
Layout tip: Use drag-to-group containers to organize surrounding tenants by category (e.g., "Quick Service Restaurants," "National Banks," "Health & Fitness"). Group only verified items, and keep the subject property visually distinct.
How to Create a Reviewed Investment-Sales Map
Here is a workflow for creating an accurate, readable retail map for an investment-sales package.
Step-by-Step Map Creation Process
- Pin your subject property with a custom, prominently labeled marker that stands out from the surrounding context
- Search the visible map area by category, review the results, and select only relevant businesses
- Search artwork candidates and verify each proposed match before placement
- Apply leader lines connecting each logo to its precise location on the map
- Group logos into labeled clusters by category (dining, financial, grocery, fitness, etc.) for quick visual parsing
- Choose among the nine map styles: Default, Subtle, Light, Dark, Retro, Silver, Night, Satellite, and Terrain
- Apply your brokerage's custom color scheme to maintain brand consistency across the entire package
- Use Pro to export a 2D PNG/JPG up to 8,000 pixels, a 3D image up to 4,096 pixels, or one of five PDF layouts
Choosing the Right Map Style for Your OM
Choose the map style according to the intended document and review it at final size. Satellite can show physical context; light and silver backgrounds may make selected artwork and leader lines easier to distinguish in some layouts.
If your OM uses a modern, clean design with plenty of white space, a silver map style maintains that visual language. For more traditional marketing packages, a light or retro style offers a professional, understated backdrop.
Evaluate the Map Workflow Against the Assignment
Do not rely on an undated comparison table for competitor capabilities or pricing. Product plans change. Instead, test each candidate with the same map brief and record:
- Whether nearby results require review and selection
- How artwork matches are proposed and verified
- Available styles, overlays, leader lines, and grouping controls
- 2D, 3D, and PDF output specifications
- Current plan price, map limits, download rights, seats, and contract terms
- The amount of rework required after the export enters the OM
For CRE Retail Maps, the facts reviewed August 3, 2026 are: Free supports building and previewing up to three maps without downloads; Pro is $39 per month or $379 per year, supports unlimited maps and downloads, and includes 2D PNG/JPG up to 8,000 pixels, 3D images up to 4,096 pixels, and five PDF layouts. Verify competitor information directly with each vendor at the time of evaluation.
Quality Control Before Distribution
Treat the map like any other evidence-bearing page. Confirm the subject address, tenant status, artwork match, business locations, leader lines, dates, source notes, and document details. If the page includes demographic, traffic, visitation, or valuation claims, cite the actual source and methodology next to those claims.
Conclusion
Retail maps can provide useful spatial context in an investment-sales package. Focus on reviewed artwork, verified locations, clear leader lines, purposeful groups, and a map style that fits the document. CRE Retail Maps lets you build and preview up to three maps on Free; Pro is required for the image and PDF downloads described above.
Related guides
- Retail maps for OMs - The investment sales use case
- Template gallery - Five PDF layout options
- Mapping for CRE brokers - Built for CRE brokers
CRE Retail Maps Editorial Team
VerifiedCRE Software & Industry Analysis
The CRE Retail Maps editorial team produces in-depth analysis of commercial real estate technology, retail market trends, and broker workflows. Our content is reviewed by retail brokers and industry practitioners with decades of combined experience covering grocery-anchored, power center, and lifestyle retail across major US markets.