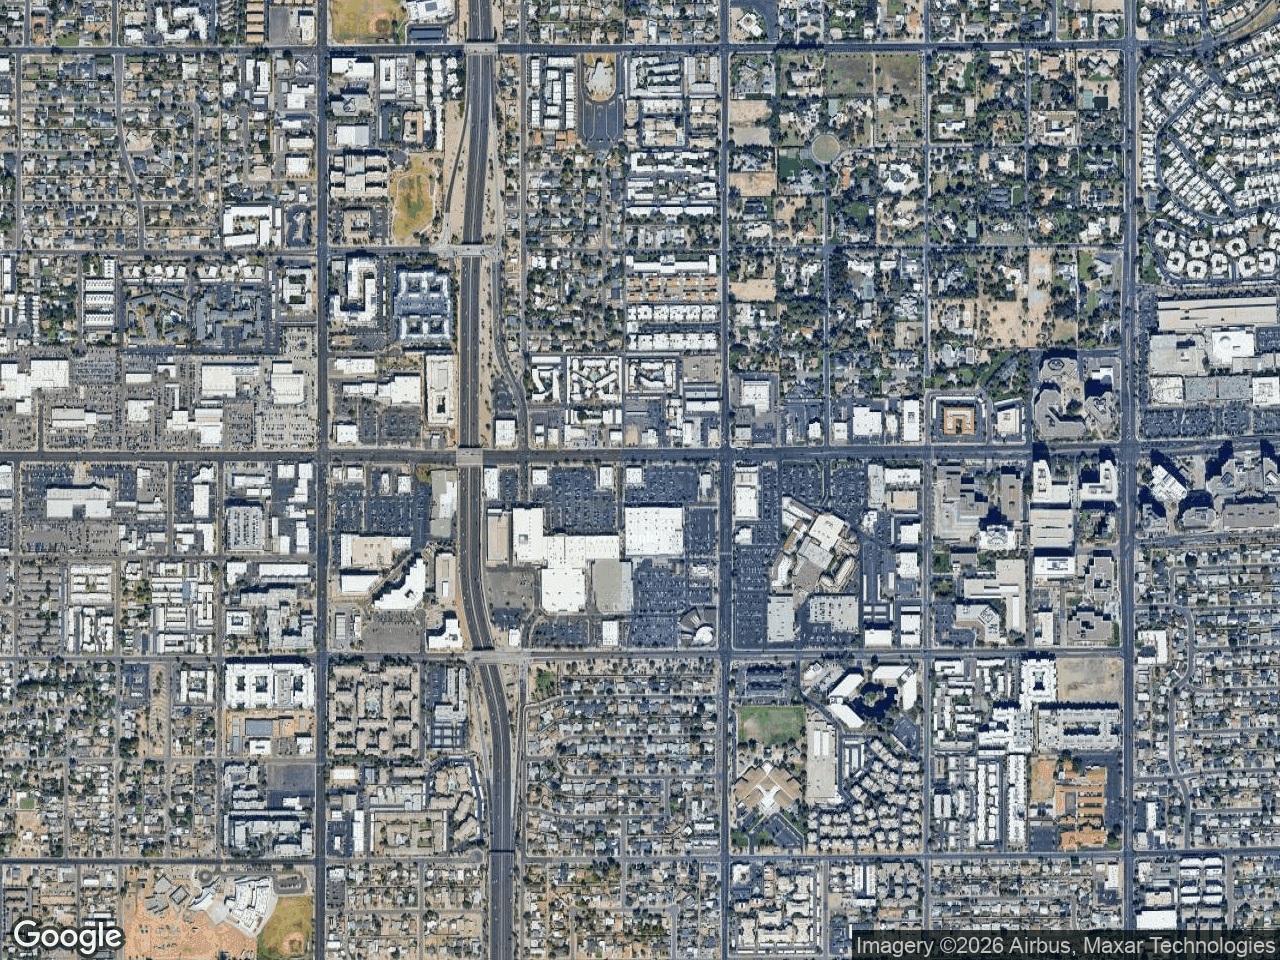



Mapping software for retailers serves two different jobs: expansion teams deciding where the next store goes, and tenant rep brokers pitching those teams on specific sites. The map that wins a real estate committee approval is not the same map that wins the assignment.
What Retailer Expansion Teams Need From Mapping Software
A retailer's real estate team already has the data. They have the demographic subscription, the sales forecasting model, and the trade area work. What they usually lack is a fast way to turn a candidate site into a page their committee can read in ten seconds.
The committee question is almost always the same: who else is already here? Not population counts, which live in the model. Co-tenancy. Which anchors are within walking distance, which direct competitors sit on the same corridor, and whether the adjacency pattern matches sites that already perform.
That is a visual problem, not an analytical one. A retailer expansion map needs to show:
- Anchor tenants and their actual positions in the center or corridor
- Direct competitors, clearly identifiable at a glance
- Complementary co-tenants that signal the right customer profile
- The subject site, marked so nobody has to hunt for it
Pull the demographics and traffic counts from your existing data provider. Use mapping software for the part your data provider handles worst, which is making the tenant mix legible on a single page.
What Tenant Rep Brokers Need Instead
A tenant rep broker is not building a case for a single site. They are building a case for themselves, then for a shortlist.
The pitch deck comes first. When you are competing for a national rollout assignment, you need to show you understand the retailer's existing footprint and the gaps in it. That means a market overview map with their stores, their competitors' stores, and the trade corridors you believe are underserved. Build one of those per target market and you have walked into the meeting with a point of view instead of a capabilities slide.
Then comes the tour book. Once you have the assignment, every site you present needs the same visual treatment so the retailer's team can compare apples to apples. Same map style, same logo treatment, same label conventions, different site. Consistency across a tour book is worth more than beauty on any single page.
Where the Two Audiences Overlap
Both sides want the same artifact: a clean tenant map that reads without explanation. The difference is direction. The retailer builds it to justify a decision internally. The broker builds it to influence that decision externally. Good retail map software for CRE brokers should produce the same quality output regardless of which chair you are sitting in.
How Mapping Software for Retailers Compares to the Alternatives
| Approach | Build speed | Brand logos | Presentation quality | Best fit |
|---|---|---|---|---|
| Google Earth screenshots | Fast | Manual paste | Low | Quick internal reference |
| PowerPoint over a map image | Slow | Manual paste | Medium | One-off site pages |
| Full GIS platform | Slow | Not a focus | Varies | Trade area and demographic analysis |
| Purpose-built retail mapping | Fast | Searchable artwork | High | Committee pages and tour books |
Most retailers and brokers end up running two tools, and that is the right answer. A GIS or demographics platform answers how many and how much. A retail mapping tool answers who is here and makes it presentable. Trying to force one tool to do both is how you end up with a map nobody wants to put in front of a committee.
Building a Retailer Site Selection Map in Practice
Here is the workflow that works for both audiences:
- Center the map on the subject property and set the zoom so the relevant co-tenancy is in frame
- Search nearby businesses by category in the visible area, then review the results and select the tenants that matter to your story
- Search brand artwork for each tenant, review the candidates, and confirm the match before placing it
- Verify each logo sits at the correct location, since a misplaced competitor undermines the whole page
- Add leader lines where logos crowd each other, so every brand connects clearly to its spot
- Group inline tenants into labeled containers to separate the anchor row from the shops
- Place the subject property marker with a label the committee will recognize
- Pick a map style that matches your brand palette, then apply your color scheme
- On a Pro plan, export a high-resolution PNG for decks, or a PDF layout for retail maps for offering memorandums and tour books. On the Free tier you can build and preview the page, but downloading it requires Pro
Steps 2 through 4 are where accuracy is won or lost. Nearby search surfaces candidates from the visible area for you to evaluate, and artwork search surfaces logo options for you to confirm. Neither one places anything on the map for you, which is exactly what you want when the output is going to a real estate committee.
Choosing a Tool: Questions Worth Asking
Before you commit to any retail expansion map tool, pressure test it against your actual deliverables:
- Can you produce a page that matches your brand colors without exporting to a design tool?
- Does it handle dense inline tenant rows, or do logos collapse into each other?
- Can you export at a resolution that survives printing and large-format display?
- Does it generate the PDF layout your OM template expects, or will you rebuild the page downstream?
- What does the plan that includes exports actually cost, and how many maps does the free option let you build before you decide?
- How long does the second map take, once you know the tool?
That last question matters most for tenant rep work. A tool that produces one beautiful map slowly is a liability when you need twelve consistent maps before Thursday. Our step-by-step guides walk through the specific build patterns for both use cases.
Pick the Tool That Matches the Deliverable
Retailer expansion teams need committee-ready co-tenancy pages that complement data they already own. Tenant rep brokers need consistent, repeatable maps across pitch decks and tour books. Both are presentation problems, and both are solved faster by a tool built for retail mapping than by a general-purpose platform bent to the task.
CRE Retail Maps is built for exactly that narrow job: searchable brand artwork, nine map styles, leader lines, grouped tenant containers, custom color schemes, and 2D PNG and JPG export up to 8000 pixels, photorealistic 3D image export up to 4096 pixels, and five PDF layouts. Access works like this: the Free tier lets you build and preview up to three maps with no downloads, so you can judge the output on your own market before paying. Downloads and unlimited maps require Pro, currently $39 per month or $379 per year. Start a map at CRE Retail Maps and see how your next site page looks.
CRE Retail Maps Editorial Team
VerifiedCRE Software & Industry Analysis
The CRE Retail Maps editorial team produces in-depth analysis of commercial real estate technology, retail market trends, and broker workflows. Our content is reviewed by retail brokers and industry practitioners with decades of combined experience covering grocery-anchored, power center, and lifestyle retail across major US markets.