




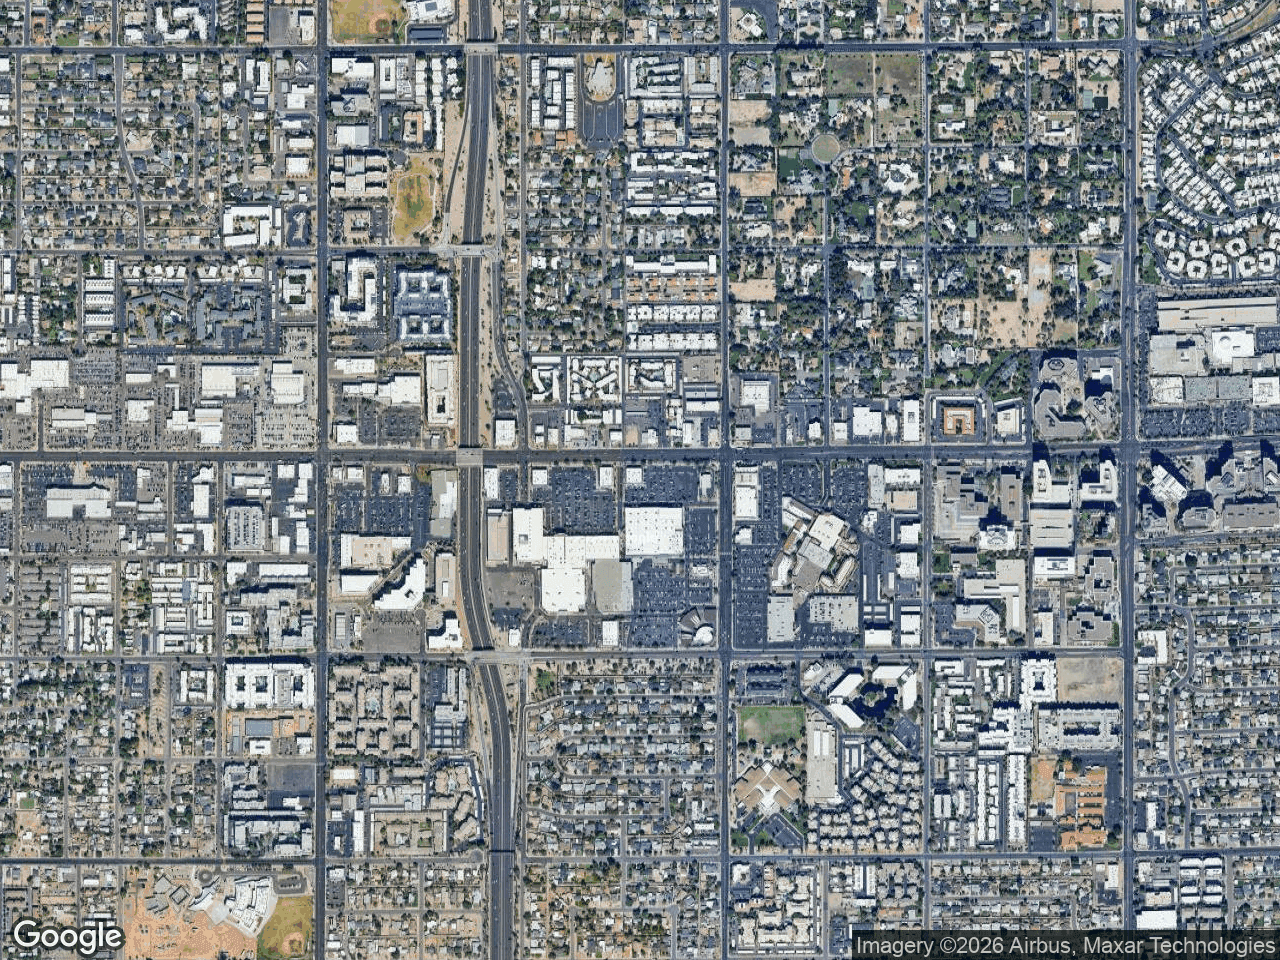
Commercial real estate maps come in six main types that brokers use again and again: retail tenant maps, location maps, site plans, trade area and demographic maps, comp maps, and parcel and zoning maps. Each one answers a different question for a buyer, tenant, or lender, and a good offering package usually includes more than one.
What Are Commercial Real Estate Maps?
A commercial property map is any visual that shows a property in relation to something that affects its value. That could be neighboring tenants, highway access, competing sites, lot lines, or the households within a trade area. Ask five brokers what a "CRE map" is and you may get five answers, because each type does a different job.
It helps to sort the types of commercial real estate maps by the question each one answers:
- Who is nearby? Retail tenant maps
- Where is it? Location maps
- What is on the site? Site plans
- Who shops here? Trade area and demographic maps
- What is it worth? Comp maps
- What can be built? Parcel and zoning maps
The six sections below cover each type, what it should include, and when to use it.
1. Retail Tenant Maps
A retail tenant map, often called a retailer map or retail aerial, places brand logos on a map around the subject property. It shows co-tenancy and nearby activity at a glance: the grocery anchor across the street, the national QSRs on the pad sites, the big-box retailers that bring shoppers to the corridor.
This is often the map prospective tenants look at first. A franchisee judging an inline space wants to see which brands are already in the area. An investor looking at a NNN deal wants to see whether the surrounding retail looks healthy and complementary.
What a strong retail tenant map includes
- A clearly marked subject property with a readable label
- Brand logos connected to their actual locations with leader lines
- Logos grouped by category or cluster so the map doesn't get cluttered
- A clean base map style that lets the logos stand out
- Colors that match the brokerage's branding
Retail tenant maps used to take hours in a design program. Dedicated retail map software for CRE brokers makes the process more structured: you search for brand artwork, review each match, and place it on the map yourself.
2. Location Maps
A location map (also called a vicinity map) zooms out to show where the property sits in the metro or region. It usually highlights major highways, interchanges, nearby cities, and landmarks like airports, hospitals, or universities.
Location maps work best near the front of an OM or flyer, before the reader gets into the details. They answer "where is this?" quickly, which matters most for out-of-market investors who don't know the area. Keep them simple. A location map with too many labels is harder to read than one showing only the roads and landmarks that matter.
3. Site Plans
A site plan shows the property itself: building footprints, suite numbers, parking, access points, curb cuts, and outparcels. For multi-tenant retail, the site plan usually doubles as a leasing plan, with available suites shaded or labeled by square footage.
Site plans usually start from an architect's or engineer's drawing, and brokers then simplify them for marketing. Make sure the suite numbers and square footages match the rent roll exactly. A leasing plan that doesn't match the rent roll invites questions no broker wants to answer during due diligence.
4. Trade Area and Demographic Maps
Trade area maps show the geography a property draws customers from, often with drive time rings, radius circles, or custom polygons. Demographic maps add data on top, like population, household income, daytime population, or consumer spending. Traffic count maps belong here too, since they show AADT figures on the roads next to the site.
These maps help tenants and investors decide whether the market can support the property. The data usually comes from demographic providers, GIS platforms, or state DOT traffic count databases, and brokers typically pull it from those sources and present it alongside the other maps in the package.
5. Comp Maps
A comp map plots comparable sales or lease comps around the subject property, usually with numbered markers tied to a table. Sale comp maps support pricing and cap rate discussions. Lease comp maps back up the rent assumptions in a pro forma.
The key is making the map match the table. Each marker number should line up with a row that shows the address, date, price or rent, and property type. Leave out comps too far away to be meaningful, since an outlier on the map can pull attention from the comps that matter most.
6. Parcel and Zoning Maps
Parcel maps show legal lot lines, parcel IDs, and acreage. Zoning maps show the zoning designation of the subject property and its neighbors. Both matter most for land deals, redevelopment opportunities, and any property where the buyer's plan depends on what the site can legally hold.
Brokers usually get parcel and zoning data from county GIS portals or municipal planning departments. Since zoning codes change, note the source and date on the map, and tell buyers to verify the details with the jurisdiction before they rely on them.
How to Choose Commercial Real Estate Maps for a Listing
Not every deal needs all six. The right mix depends on the property type and the audience:
| Deal type | Maps that usually matter most |
|---|---|
| Single-tenant NNN investment sale | Location map, retail tenant map, sale comp map |
| Multi-tenant retail leasing | Site plan, retail tenant map, trade area map |
| Shopping center investment sale | Site plan, retail tenant map, demographic map, comp map |
| Land or redevelopment site | Parcel map, zoning map, location map |
| Pad site or outparcel | Retail tenant map, traffic count map, site plan |
A typical order in an offering memorandum goes from general to specific: location map first, then the retail tenant map, then the site plan, followed by market data and comps. That order lets the reader see the region first and then move in to the property.
Keep the maps visually consistent
When a package mixes maps from different sources, the design often doesn't match. Use the same brokerage colors, fonts, and subject property marker on every map where you can. Consistent maps make the OM look like one finished document instead of pages pulled from different tools. For layout ideas, see this guide to retail maps for offering memorandums.
Conclusion
Each type of commercial real estate map answers its own question, and the strongest marketing packages use several of them together. Location maps and site plans set the context, trade area and comp maps back up the numbers, and parcel and zoning maps cover what can be built.
For the retail tenant map, CRE Retail Maps is made for the job. You can search for brand artwork and nearby businesses in the visible map area, review the results before placing them, connect logos with leader lines, group them into labeled clusters, and choose from nine map styles, including Satellite. Maps export as 2D PNG or JPG images up to 8000 pixels or as photorealistic 3D images, and five PDF layouts are ready for OMs and presentations. You can build and preview up to three maps free at CRE Retail Maps.
CRE Retail Maps Editorial Team
VerifiedCRE Software & Industry Analysis
The CRE Retail Maps editorial team produces in-depth analysis of commercial real estate technology, retail market trends, and broker workflows. Our content is reviewed by retail brokers and industry practitioners with decades of combined experience covering grocery-anchored, power center, and lifestyle retail across major US markets.