One of the most common requests from tenants and investors looking at a commercial property is simple: "What's nearby?" They want to know which retailers, restaurants, and services surround the site. A list of addresses doesn't cut it - they need a visual map that shows the surrounding tenant mix at a glance.
Building that map manually can mean researching businesses, finding usable artwork, and placing each item one by one. This tutorial shows you how to use nearby-business search and Pro POI tools in CRE Retail Maps, while keeping you in control of what appears on the final map.
Why Surrounding Tenants Matter in CRE
Before diving into the how-to, it's worth understanding why nearby tenant maps are so effective in commercial real estate marketing.
For retail leasing, prospective tenants may want visual context about complementary businesses. Showing selected, verified nearby locations can support that discussion, but the map does not establish office density, foot traffic, or demand.
For investment sales, selected nearby retailers can provide location context. Do not present recognizable brands as proof that the subject property is strong or as a substitute for the rent roll and market evidence.
For site selection, a map can present selected nearby businesses by category. Demographic fit, demand, and co-tenancy conclusions require separate, sourced analysis.
In all three cases, the map presents selected locations spatially alongside the subject property; keep analytical conclusions tied to appropriate source data.
Step 1: Set Your Subject Property
Start by navigating to your property's location on the map. You can search by address or scroll and zoom to the site. Once you're centered on the property, you have your base map ready.
Choose a map style that works for your presentation. For surrounding tenant maps, the "light" or "default" styles tend to work well because they keep the background clean while still showing street names and landmarks. If you're creating a map for a nightlife or entertainment district, the "dark" or "night" styles can add visual impact.
Step 2: Search for Nearby Businesses by Category
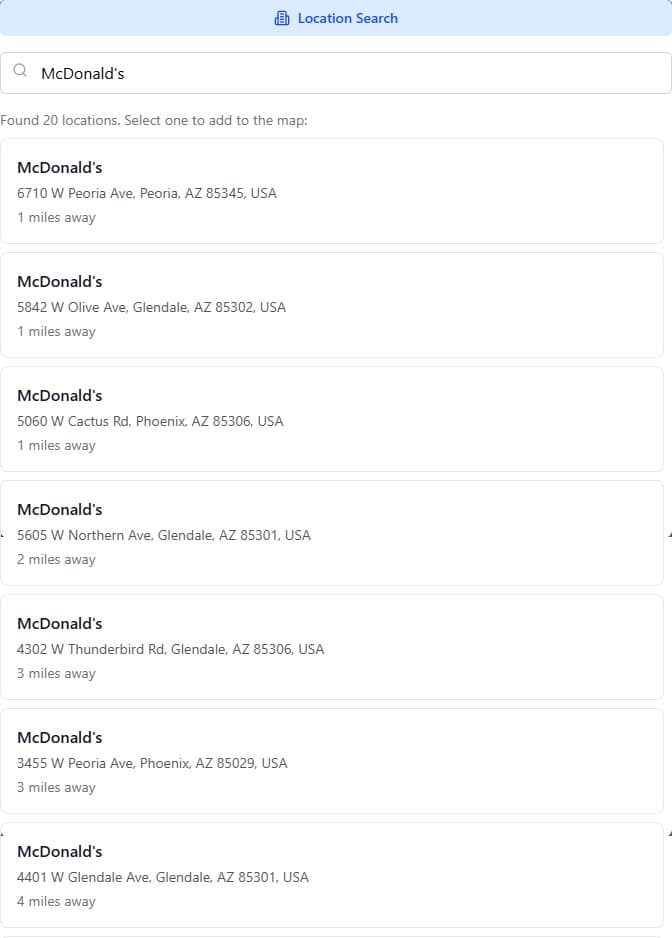
This is where the process diverges from the old manual approach. Instead of Googling "restaurants near 123 Main Street" and cross-referencing results, you use the built-in category search.
CRE Retail Maps lets you search by business category - restaurants, banks, grocery stores, pharmacies, fitness centers, coffee shops, and more. A category search returns businesses in the visible map area. Review the results, confirm the locations that matter to your assignment, and select only the businesses you want to add.
Here's a practical workflow:
- Search "grocery" to find supermarkets and specialty food stores in the area. Place the ones most relevant to your narrative.
- Search "bank" to show financial institutions - Chase, Bank of America, Wells Fargo - that signal commercial density.
- Search "restaurant" to review dining options. For a retail property, nearby restaurants may help explain the surrounding mix, but they are not a substitute for measured foot-traffic or daytime-population data.
- Search "fitness" to show gyms and studios that drive repeat visits to the area.
For selected results, search the library of brand-artwork candidates and review the proposed match before placing it. Confirm both the business location and the artwork yourself; names can be similar and business records can change.
Step 3: Fine-Tune Placement with Leader Lines
Once you've placed 15 to 25 nearby tenants on your map, some logos will naturally overlap or cluster together, especially in dense retail corridors. This is where leader lines and drag-to-group containers become essential.
Leader lines are connector lines that link a logo to its exact location on the map. You can move the logo to an open area of the map for readability while the leader line maintains the geographic connection. This keeps the map accurate without sacrificing legibility.
Drag-to-group containers let you cluster multiple tenants into a labeled group - for example, grouping all the tenants in a neighboring shopping center under a single container titled "Riverside Plaza." This organizes the map and tells a clearer story about the retail nodes surrounding your property.
Step 4: Save Reusable Locations with Pro POIs
If you work in the same market repeatedly, you may place the same nearby tenants on multiple maps. Pro users can save locations as POIs (points of interest) and reuse that curated market knowledge across their own projects.
For example, if there's a Target, a Whole Foods, and a Starbucks that show up on nearly every map in your submarket, save them as POIs. The next time you create a map in that area, you can pull them in with one click instead of searching again. Over time, your POI database becomes a curated library of your market's key tenants.
That can make repeat assignments more consistent. For team use, confirm how your brokerage wants to review, maintain, and share its market data; do not assume that an account's POI list is a live shared-team database.
Step 5: Style and Export
With your nearby tenants placed and organized, apply finishing touches:
- Highway highlighting: Adjust the color, weight, and opacity of major roads to show access and visibility. A property on a highlighted arterial road tells a stronger location story.
- Label controls: Toggle street names, highway labels, transit stops, and water features on or off depending on what's relevant to your audience.
- Color scheme: Use your brokerage's brand colors with the custom color picker, or choose from 12 preset swatches for a polished look.
When the map is ready, Pro users can export a 2D PNG or JPG at custom dimensions up to 8,000 pixels, a 3D image up to 4,096 pixels, or one of five PDF layouts. Choose the format and dimensions for the document where the map will appear, and review the exported file in that document before distribution.
The Bigger Picture
A surrounding tenant map is a practical way to answer the "What's nearby?" question and give readers visual context for the location. Its value depends on accurate selections, clear labeling, and a layout that supports the property's actual story.
With nearby search and Pro POIs in CRE Retail Maps, you can keep discovery, selection, artwork review, placement, and export in one workflow. A curated POI library can also reduce repeated research on later maps in the same market.
The Free plan lets you build and preview up to three maps. A Pro subscription is required to download exports.
Related guides
- All features - Nearby search, artwork, styling, and export options
- Retail map maker - The full map workflow
- Mapping software for brokers - Built for this use case
CRE Retail Maps Editorial Team
VerifiedCRE Software & Industry Analysis
The CRE Retail Maps editorial team produces in-depth analysis of commercial real estate technology, retail market trends, and broker workflows. Our content is reviewed by retail brokers and industry practitioners with decades of combined experience covering grocery-anchored, power center, and lifestyle retail across major US markets.