


Every CRE deal has a moment where the prospect stops reading and starts picturing. In a leasing pitch it's when the prospective tenant imagines their customers walking in. In an investment sale it's when the buyer maps the trade area against their portfolio. Get that mental picture formed early and you compress the decision cycle; fail to form it and the deal stalls in "let me think about it" territory.
Professional retail maps are the single best tool a broker has for forming that picture fast. They take the location's value from words on a page to something a prospect can see at a glance. Here are five specific ways a polished retail map moves deals through your pipeline faster, with the mechanics behind each and the rough time savings you should expect.
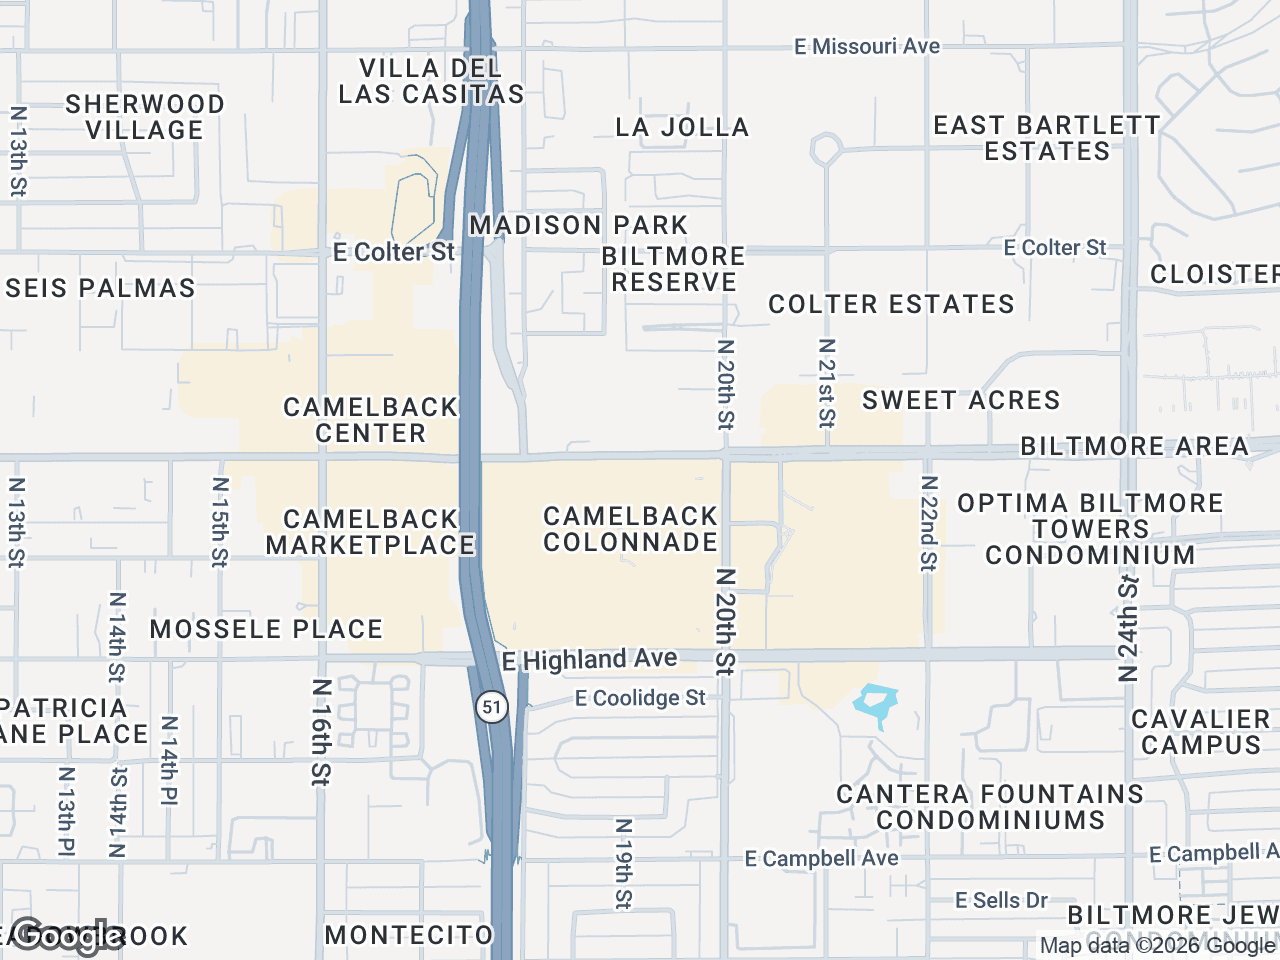
1. Show the Full Retail Ecosystem in One Frame
A prospect looking at a CRE opportunity is really asking one question: is this a good location? The answer lives in the surrounding retail context - who the neighbors are, what traffic generators pull customers to the area, where the competition sits. You can answer that in 10 pages of narrative or you can answer it with a single map.
A well-designed retail map shows subject property, anchor tenants within a quarter mile or half mile, complementary retailers clustered by category, and major traffic arteries. When a buyer sees a Target across the street, a Whole Foods two blocks south, and a Chick-fil-A pulling drive-through traffic from the main artery, they've evaluated the location before they've read your financials.
Speed impact: an OM gets skimmed before it gets read. A strong retail map makes that first pass work for you. Without one, the same prospect scrolls past your location analysis and decides based on rent roll and cap rate alone - which is a worse argument when the location is actually your strongest feature.
2. Official Brand Logos Build Instant Credibility
There's a visible gap between a marketing piece built by a broker and one built by a design team. Part of that gap is fonts, part is layout, but a surprisingly large part is how brand logos are handled. A map with grainy PNG logos copied from Google Images signals amateur. A map with crisp, official brand logos signals a brokerage that treats its listings seriously.
CRE Retail Maps ships with 1,000+ official brand logos - Starbucks, Target, Chase, Whole Foods, CVS, Chipotle, Chick-fil-A, Home Depot, and hundreds more. Each one is served from the brands' CDN sources at print-quality resolution. You type a name, drop the logo on the map, and it looks like a licensed asset because it is one.
Speed impact: prospects subconsciously rank your OM against the last five they received. The one with sharp logos and consistent styling gets the callback. The one that looks like a PowerPoint deck from 2015 goes in the "maybe later" pile. Logo quality is a small thing that routes deals toward or away from your listing at the skim stage.
3. Branded Templates Make Every Map Feel Like Yours
Marketing consistency is brand equity. The OM, the flyer, the email blast, and the website all need to feel like they came from the same brokerage. When your retail maps look different from each other - because the broker building them picked different colors, logos, and layouts every time - your marketing feels ad hoc.
Branded PDF templates solve this by baking in your brokerage's visual identity: logo in the header, agent photo and contact info in the footer, your brand colors on the leader lines and accents. Every map your team exports inherits those defaults. A junior broker producing their first map gets output that looks like it came from the brokerage's design team.
Speed impact: this mostly matters at the pipeline level, not the individual deal. When your collateral looks consistent, referrals are easier to generate, repeat clients expect the level of quality, and your brokerage builds a visual reputation. Each of those shaves days off future deals.
4. Auto-Find Nearby Businesses Cuts Hours of Research
The slowest part of building a retail map the old way isn't placing logos - it's finding which retailers to place. A broker typically opens Google Maps in six tabs, searches for "restaurants near [address]", "banks near [address]", "grocery near [address]", screenshots each one, transcribes the names into a spreadsheet, then cross-references with brand lookup services to get logos. That's the 2-3 hour portion of a "5-hour retail map" project.
Auto-find collapses this entire research phase. You pick a category (restaurants, banks, grocery, fitness, coffee, pharmacy, or custom combinations), CRE Retail Maps queries the Google Places network, and within a few seconds every matching business within your chosen radius is pinned on the map with its name and address. Logos auto-attach where they match a brand in the library. The research phase that used to take hours now takes about 60 seconds.
Speed impact: auto-find removes most of the manual research and logo hunting. More importantly, it lets you turn around a map the same day a prospect asks, instead of three days later.
5. Instant Revisions Keep Deals Moving
Deals die when momentum stalls. A prospect sees the map, asks for a small change - "can you add the two restaurants on the south side" or "can we switch the background to something darker for print" - and the broker has to go back to their designer or their PowerPoint workspace. Three days later the revised map lands in the prospect's inbox, and by then the prospect has moved on to three other listings.
Purpose-built retail mapping lets you handle those revisions in real time. During a video call you can drag an anchor tenant into view, change the map style while the prospect watches, group tenants into a labeled cluster, and export a fresh PDF before the call ends. Full undo and redo means you experiment freely without fear of losing work. Autosave means you never have to re-explain changes because a tab crashed.
Speed impact: the iteration loop goes from days to minutes. Prospects feel heard because their feedback lands in the next version they see. Deals that would have stalled during the revision cycle stay in motion.
A Rough Time Comparison
The figures below are illustrative estimates, not measured benchmarks. Your own times will differ:
| Activity | Manual (PowerPoint) | CRE Retail Maps | Difference |
|---|---|---|---|
| Research nearby tenants | 60-90 min | 1-2 min | ~1.5 hours |
| Find + place brand logos | 45-60 min | 5-10 min | ~50 min |
| Build leader lines + styling | 30-45 min | 5 min | ~35 min |
| Branded template + export | 20-30 min | 2 min | ~25 min |
| Revisions per map (avg 2 rounds) | 60 min | 5 min | ~55 min |
| Total per map | ~4 hours | ~20 min | ~3.5 hours |
If those estimates hold for your workflow, a broker building one map a week recovers a meaningful part of a workday each month. Whether that is worth $39 depends on what your time is worth.
The Deeper Point: Speed Changes Which Deals You Take
Most brokers think of mapping speed as a cost saving. The bigger impact is on which deals you pursue. When a retail map takes 4 hours, you only build one for deals that are already qualified - the active listings, the hot investor pitches. You skip the speculative map for the prospect who might or might not be serious, the quick trade-area visual for the cold outreach, the second-look map for a deal you're reconsidering.
When a retail map takes 20 minutes, the calculus flips. You build a polished map for the cold investor who asked a casual question, you include one in every outbound flyer instead of just the featured listings, you show up to every meeting with a fresh visual rather than reusing last year's. More maps at lower cost per map means more deals in motion, which means more deals close.
The Bottom Line
Retail maps aren't cosmetic. They're the tool that answers "is this a good location?" faster than financial analysis does, and they compound when they're consistent across a team's entire pipeline. A broker shipping five polished maps per month will out-close a broker shipping one every quarter, not because the maps are magic but because they remove the friction in every pipeline touchpoint.
Start building. Sign up free at app.creretailmaps.com - no credit card, full free tier. Your next listing deserves a polished retail map, and your pipeline deserves five more of them this month.
Related guides
- Mapping software for CRE brokers - Built for the broker workflow
- Retail maps for OMs - Institutional-grade OM maps
- Branded PDF templates - Templates for every deal type
CRE Retail Maps Editorial Team
VerifiedCRE Software & Industry Analysis
The CRE Retail Maps editorial team produces in-depth analysis of commercial real estate technology, retail market trends, and broker workflows. Our content is reviewed by retail brokers and industry practitioners with decades of combined experience covering grocery-anchored, power center, and lifestyle retail across major US markets.